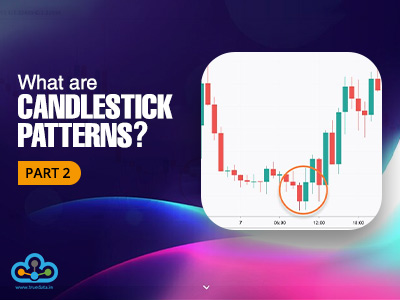
Trend trading is one of the most popular forms of trading for a trader, especially novice traders who are still trying to get the maximum expertise in this craft. The primary requirement for trend trading is identifying current trends and the signals for trend reversals to know the potential entry and exit points. This is where the inverted hammer candlestick pattern comes into the picture. Check out this block to know the meaning of the inverted hammer candlestick pattern and its related details to create a successful trading portfolio.

The inverted hammer pattern is a candlestick formation employed to identify a potential reversal in a bullish trend. This candlestick pattern emerges backed by the increased bullish pressure after a downtrend. This results in a short lower shadow and a long upper shadow, resembling an inverted hammer. The extended upper wick signifies the bulls' attempt to push prices upward. However, this pattern serves as an indicator for a trend reversal rather than a conclusive signal, thereby suggesting a possible shift in price direction rather than guaranteeing one. Traders often use the inverted hammer to
Traders often use the Inverted Hammer as a signal to assess potential changes in market sentiment and to identify a bullish reversal. The reliability of this pattern is heightened when complemented by additional technical analysis tools and confirmation from subsequent price movements. It serves as a valuable element in the trader's toolkit, aiding in making well-informed trading decisions and thereby shaping a successful trading portfolio.
The inverted hammer pattern as the name suggests looks like an inverted hammer. However, in the wake of the dynamic markets that we have today, it is easy to misidentify this pattern or the trading signal. Here are a few steps to identify the inverted hammer pattern correctly and thereby have a correct interpretation of the trading signal.
Look for a single candlestick with a short lower shadow and a long upper shadow.
Observe the candle's body, which is typically small and positioned near the low of the trading range.
Recognize the overall shape resembling an inverted hammer, with a focus on the extended upper wick.
This pattern is most relevant when observed after a downtrend, making it crucial to consider the prior trend.
To strengthen the signal, traders should look for subsequent bullish price action or confirmation from other technical indicators. Pay attention to the colour of the candle. While it can vary, a white or green inverted hammer may enhance the signal.

The steps to trade using the Inverted Hammer pattern are explained in detail hereunder.
Formation of Inverted Hammer - The Inverted Hammer candlestick pattern emerges when bulls resist the downward trend, leading to a notable recovery in prices during the trading session.
Battle between Bulls and Bears - Bears attempting to dominate the market may challenge the bulls, pushing for a price recovery in the subsequent day.
Confirmation of Price Reversal - The Inverted Hammer pattern indicates a bullish reversal when bearish sentiment fails to rally, allowing the price to ascend, and the bulls to maintain control.
Confirmation through Subsequent Candle - Traders, upon observing the Inverted Hammer, should await the formation of the next candle for confirmation.
Red Candle as a Caution Signal - If the next candle is red, it suggests pattern failure, and traders should exercise caution as the price may fall below the Inverted Hammer.
Green Candle Affirmation - A green next candle confirms the bulls' control, prompting traders to wait for the price to surpass the Inverted Hammer, validating a potential further rise.
Setting Stop-Loss - Traders should set the stop-loss at the bottom price of the Inverted Hammer pattern to limit exposure in case of pattern failure and price decline.
Risk Management Strategy - In the event of a failed pattern, the stop-loss helps traders cut losses, ensuring a disciplined and risk-aware approach in the dynamic Indian market.
Although the Inverted Hammer pattern is a very popular candlestick pattern often used by traders across the world, it is important to understand it thoroughly before its implementation. Understanding the pros and cons of using the inverted hammer pattern is part of this process. A few pros and cons of using the inverted hammer pattern are highlighted below.

The inverted hammer pattern is a very useful tool for identifying the presence and dominance of bulls and bears and thereby the overall market sentiment and executing a trading plan. While it is easy to identify this pattern, it is also quite easy to misinterpret it in the absence of other technical indicators. Therefore, it is important for traders to identify it correctly and use this pattern in conjunction with other indicators to have a successful trading portfolio.
We hope this article was able to simplify the understanding and implementation of the inverted hammer pattern for traders. Let us know if you have any queries regarding the same or want to know more about similar candlestick patterns and we will take them up in our coming blogs.
Till then Happy Reading!
Read More: All about Doji Candlesticks
Read More: Boost Your Trading Strategy with TrueData Ninja Indicator

Candlestick patterns are among the most basic and common tools traders use to cr...

The use of technical analysis for trading is vital for creating a successful tr...

Stock markets have been under a lot of pressure in the past week and investors ...