
It is easier to take suitable trading positions when there is a clear market direction of an uptrend or a downtrend. However, what do you do when there is no clear direction? Such markets are when the prices bounce between a specific range and there are no clear breakouts. This is where traders use range-bound strategies to navigate such markets and make the most of the situation. This range-bound trading can often be tricky for traders without a good understanding of the market movements and typical market sentiment guiding these markets. Here is a brief explanation of range-bound trading and how to navigate sideways markets.

Range-bound trading is a strategy used by traders when the prices of stocks, commodities, or other financial instruments move within a specific range, without a clear upward or downward trend. In such markets, prices typically oscillate between a defined high (resistance) and a low (support) level. Traders capitalise on these predictable price movements by buying near the support level and selling near the resistance level. This approach requires careful observation and analysis to identify the range and anticipate price reversals. Range-bound trading is particularly useful in sideways markets, where there are no strong trends, and it helps investors make the most of market fluctuations by taking advantage of short-term price movements.

Traders can recognise sideways markets and adjust their trading strategies to take advantage of the predictable price movements within the established range. The factors that can be used to identify a sideways market are highlighted here.
Prices in a sideways market move within a stable range without a clear upward or downward trend. Traders can identify this by observing price charts and noticing that prices bounce between a specific high (resistance) and low (support) level without breaking through these boundaries.
Technical indicators are a useful technical analysis too to spot a sideways market. Moving averages, such as the 50-day and 200-day averages, should appear relatively flat and close to each other in a sideways market. The Relative Strength Index (RSI) can also be used to analyse a sideways market as it will typically hover between 30 and 70, indicating no strong bullish or bearish momentum.
Trading volume in a sideways market is usually lower compared to trending markets. A reduced trading volume may indicate less interest from traders which can also be the contributing factor for prices not going beyond breakout points. However, traders can also pay attention to volume spikes when prices approach support or resistance levels, as these can signal potential reversals.
Traders can also use economic indicators and news events to identify a sideways market. During periods of economic uncertainty or when there are no major news events driving market sentiment, markets often move sideways. Similarly, corporate earnings reports that don’t significantly impact investor sentiment can lead to a sideways market.

Trading indicators are one of the most popular ways to identify sideways markets and trade using the analysis thereof. Here are a few popular trading indicators that are used for trading in a sideways market.
Moving averages, such as the 50-day and 200-day moving averages, can help traders identify the average price over a specific period. These moving averages appear flat and close to each other in a sideways market which can indicate that there is no clear trend. Traders use these averages to confirm that the market is moving sideways and to identify potential entry and exit points.
The Relative Strength Indicator (RSI) measures the speed and change of price movements. The RSI in a sideways market typically fluctuates between 30 and 70. This range indicates that the market is neither overbought nor oversold, suggesting a lack of strong momentum in either direction. Traders use RSI to spot potential reversal points within the range.
Bollinger Bands consist of a middle band (a moving average) and two outer bands that represent standard deviations above and below the moving average. In a sideways market, the bands are narrow which can indicate low volatility and stable prices. Traders use Bollinger Bands to identify overbought or oversold conditions and potential breakout points when the price moves toward the upper or lower band.
Support and resistance levels are horizontal lines drawn on a price chart to indicate areas where the price has consistently found support (low) or resistance (high). The prices of securities prices tend to bounce between these levels in a sideways market. Traders use these levels to plan their trades, buying near support and selling near resistance to capitalise on the predictable price movements.
The MACD is a momentum indicator that shows the relationship between two moving averages of a security’s price. In range-bound trading, the MACD can help identify potential buy and sell signals. When the MACD line crosses above the signal line, it indicates a potential buy signal. On the other hand, when the MACD line crosses below the signal line, it indicates a potential sell signal.
Volume analysis involves looking at the number of shares or contracts traded over a period. In a sideways market, trading volume is usually lower than in trending markets. However, spikes in volume when the price nears support or resistance levels can indicate potential reversals. Traders use volume analysis to confirm the strength of support and resistance levels and to gauge market sentiment.
Range bound trading, also known as range trading, involves buying and selling within a specific price range. This strategy is suitable for markets that are moving sideways, with prices oscillating between defined support and resistance levels. A clear understanding of trading strategies applicable in the range bound markets can help traders capitalise on predictable price movements. Here are a few popular range bound market trading strategies.

The foundation of range-bound trading is identifying key support and resistance levels. Traders buy when prices approach the support level and sell as prices near the resistance level. This strategy relies on the assumption that prices will continue to oscillate within this range. Accurate identification of these levels is crucial, and traders often use historical price data and chart patterns to pinpoint these zones.

Although range bound trading focuses on trading within a range, traders should also be prepared for breakouts. A breakout occurs when the price moves beyond the defined support or resistance levels. Traders often place stop orders just outside the range to capture significant price movements when a breakout occurs. This strategy can help mitigate risks and take advantage of potential new trends.

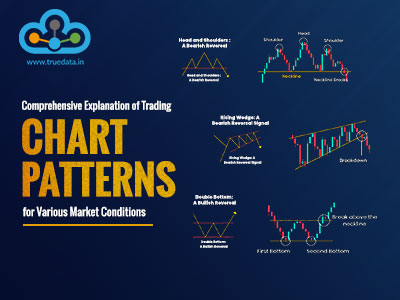
Price action trading involves analysing basic price movement without relying heavily on indicators. Traders look for patterns such as double top, double bottom , and head and shoulders within a range bound market. These patterns help traders identify potential reversal points and entry/exit opportunities within the range.

Candlestick patterns, such as doji, hammer, and engulfing patterns, can provide valuable signals for range-bound trading. These patterns help traders identify potential reversals and continuation points within the range. For example, a hammer pattern near a support level might signal a buying opportunity, while an engulfing pattern near a resistance level might indicate a selling opportunity.

The mean reversion strategy is based on the idea that prices will tend to move back to their historical average. In range-bound trading, this means buying when prices are significantly below their average and selling when prices are above their average. This strategy often employs statistical tools and moving averages to identify the average price and appropriate entry and exit points.
Range bound trading is a strategic approach where traders capitalise on predictable price movements within a defined range. Without clear market directions, trading within a particular price range can be tricky for traders, hence, using efficient range bound trading strategies can help traders navigate market conditions characterised by stable price ranges and lack of clear trends. However, it is also important to implement risk management tools like stop-loss and take-profit orders to further strengthen trading discipline.
This blog was a brief insight into range bound trading and implementing sound trading strategies to navigate sideways markets. Let us know if you have any queries on range bound trading or any other trading style and we will address them.
Till then, Happy Reading!
Read More: Binary Option Trading - All you need to know
Click Here To Get Live Data of NSE
Marisha Bhatt is a financial content writer @TrueData.
She writes with the sole aim of simplifying complex financial concepts and jargon while attempting to clarify technical and fundamental analysis concepts of the stock markets. The ultimate goal is to spread vital knowledge and benefit the maximum audience. Her Chartered Accountant background acts as the knowledge base to help clarify crucial concepts and create a sound investment portfolio.

In the world of high-speed trading, success often hinges on capitalising on even...
The use of technical analysis for trading is vital for creating a successful tr...

Algo trading in India is growing exponentially, with a market size of USD 562.20...