
With the outcome of the Indian General Elections around the corner, the Indian stock market are seeing huge volatility. While this has made many investors lose bucketloads of their wealth, there are also many trading opportunities to explore. There are many trading indicators that can be used to find them and one such indicator is the VWAP. Check out this blog to know the meaning of VWAP and how to use it for trading.

The VWAP indicator stands for Volume Weighted Average Price and is used by traders across the globe to analyse the average price of the security over a period of time taking into account both its price and volume. This indicator is particularly useful for intraday trading as it helps in seeking the benchmark for evaluating whether the current price is above or below the average traded price for the day. This information can be used to identify potential entry and exit points based on trading volume and price movements. The comparison of the current price to the VWAP can also help traders in the decision-making processes like trend analysis and understanding overall market sentiment.
As mentioned above, the VWAP is a trading indicator used to measure the average price of a security over a specific period weighted by its trading volume. The formula to calculate the Volume Weighted Average Price is mentioned hereunder.

VWAP = ∑ (Price x Volume) / ∑ (Trading Volume)
Where,
Price refers to the actual price at which a security is traded during a specific time.
Volume represents the number of shares exchanged during that same time period.
Total trading volume is the sum of all shares traded over a defined timeframe.
Consider the price and volume data for shares of Company X being traded throughout the day.

Calculating the VWAP from the above data -
Step 1 - Calculate Price × Volume for Each Time Interval -
9.30 am - 100*10000 = 1000000
10.00 am - 102*8000 = 816000
10.30 am - 101*12000 = 1212000
11.00 am - 103*6000 = 618000
Step 2 - Sum up the Products -
∑ (Price x Volume) = 1000000+816000+1212000+618000 = 3646000
Step 3 - Sum up the Volumes -
∑ (Trading Volume) = 10000+8000+12000+6000 = 36000
Step 4: Calculate VWAP -
VWAP = ∑ (Price x Volume) / ∑ (Trading Volume)
VWAP = 3646000 / 36000
VWAP = 101.2778
This implies that the average price of the stock when weighted or compared taking into consideration the volume traded during the trading day is Rs. 101.2778.
This data can provide a better analysis for the traders to understand the price movements of the security thereby giving a more accurate picture of the day's trading activity compared to a simple average price.

VWAP is a trading indicator that can be used for an in-depth market analysis and implementing an effective trading plan. The use of VWAP in trading can be explained hereunder.
VWAP is widely used in day trading strategies. Traders can compare the current market price of a stock to its VWAP to determine whether the stock is trading above or below its average price for the day. If the current price is above VWAP, it may indicate strength or bullish sentiment. Conversely, a price below VWAP might suggest weakness or bearish sentiment.
VWAP can assist in managing intraday positions. Traders may consider scaling in or out of positions based on whether the price is trading above or below VWAP. For example, if holding a long position and the price is below VWAP, it could signal a potential exit point or profit-taking opportunity.
Traders often use VWAP as a benchmark to evaluate their own trades. They compare their execution prices to VWAP to assess whether they traded better or worse than the average market participant. If a trader consistently achieves prices better than VWAP, it may indicate skill or effective execution strategies.
VWAP incorporates volume into its calculation, making it useful for confirming price movements. Traders can analyse volume alongside VWAP to validate price trends. A price move accompanied by strong volume and aligned with VWAP direction can be seen as more significant and reliable.
Traders should select appropriate time frames for VWAP analysis based on their trading style and objectives. Common time frames include intraday (e.g., 1-minute, 5-minute) and longer-term (e.g., daily, weekly) VWAP. Intraday traders often focus on shorter time frames to capture intraday trends, while swing traders may use daily or weekly VWAP for broader market analysis.
VWAP can also aid in risk management. Traders may use VWAP levels as stop-loss or take-profit points, aligning with their risk tolerance and trade objectives. Setting stop-loss orders based on VWAP can help traders exit losing positions if the price moves decisively against their trade.
Some traders employ mean reversion strategies using VWAP. This includes looking for situations where the price significantly deviates from VWAP, anticipating a return to the average. For example, if a stock's price spikes well above VWAP, traders might anticipate a pullback towards VWAP and plan trades accordingly.
VWAP is a popular trading indicator and serves as a versatile tool that enhances decision-making processes and contributes to more informed and disciplined trading practices. However, it is important to note that VWAP is not free from its set of limitations and therefore should not be used in isolation.
This article talks about the meaning of VWAP and how it is a versatile and important trading indicator for traders across the globe. Let us know if you have any queries related to this topic or need information on any other trading indicator and we will take it up in our coming blogs.
Till then Happy Reading!
Read More: What is Dow Theory?
To Know More About Reliable and Accurate Trading Indicators
Marisha Bhatt is a financial content writer @TrueData.
She writes with the sole aim of simplifying complex financial concepts and jargon while attempting to clarify technical and fundamental analysis concepts of the stock markets. The ultimate goal is to spread vital knowledge and benefit the maximum audience. Her Chartered Accountant background acts as the knowledge base to help clarify crucial concepts and create a sound investment portfolio.

The world of trading is like a maze with a constant race to find the optimum tra...
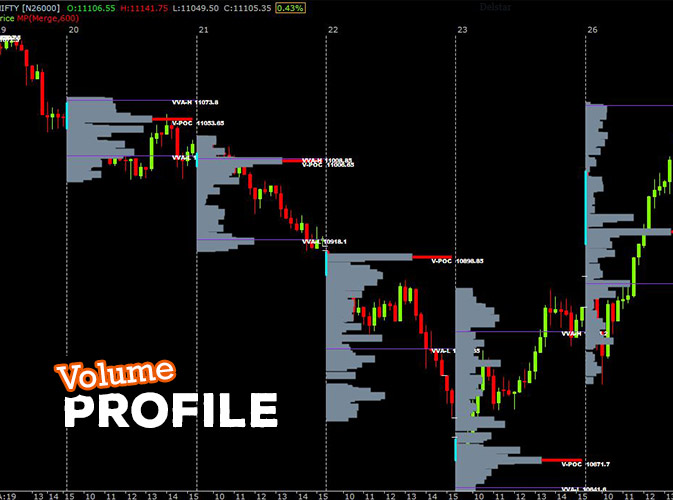
What is Volume Profile? Volume Profile is a visual representation of how muc...

It is a fact that technical analysis is the basis of analysing stocks. What does...