Introduction
Lately, several traders have started using Range Bars for their trading systems rather than the standard candlestick charts. By migrating their trading systems from the standard time-based (1min, 5 min, etc..) candlestick charts to Range Bars, traders are looking to overcome the losses they encounter during sideways markets. The best part is that it is easily possible to Display and Work with these Range Bars in Amibroker.
But ..What are Range Bars?
- Range Bars are price-driven bars, with each bar having a required minimum high-low range. The data is consolidated into one bar until the range requirement is reached, after which a new bar is started.
- These Charts consider only the range of price movement. They ignore the time at which the quote came into the charts. So the time on the chart need not be evenly spaced & depends upon whether a trend is in place or not.
- The next candle will just not be formed unless the price moves outside the range specified. When the next candle does show up, it shows a possible trend in the direction of the new candle, for that range.
- When the markets are not trending, you will see a lesser number of bars. Whereas, when the markets are volatile or start trending, the number of bars, will increase, for the same time.
- To a certain extent, this eradicates the problem of trading whipsaws and losing money in sideward markets.
Range Bar Rules
Each range bar must:
- have a high/low range that equals the specified range
- open outside the high/low range of the previous bar
- must close at either its high or its low
How do we see these Range Bars in Amibroker?
Amibroker fully supports Range Bar charting and the bar size is based on the Tick Size of a given symbol. This allows us to define symbol-specific tick sizes individually. You can then display a chart that, for example, shows 10R or 40R bars. 10R / 40R meaning bars using a range of 10-ticks / 40 ticks for each symbol respectively. To display range charts, you will need to follow the following steps:-
- Ensure that you are set up for a Base Time Interval of Tick in your database setting.
- Specify the Tick Size in the Symbol–>Information. For NSE symbols, it is 0.05, as shown here.
Specify the Tick Size
- Once Tick Size has been defined, the custom range intervals needs to be defined, to display the chosen range chart.
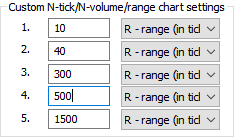
- Go to Tools–>Preferences, Intraday tab. Here you can set different range values as desired by you, say, 10, 40, 50, 200, 1500, etc...
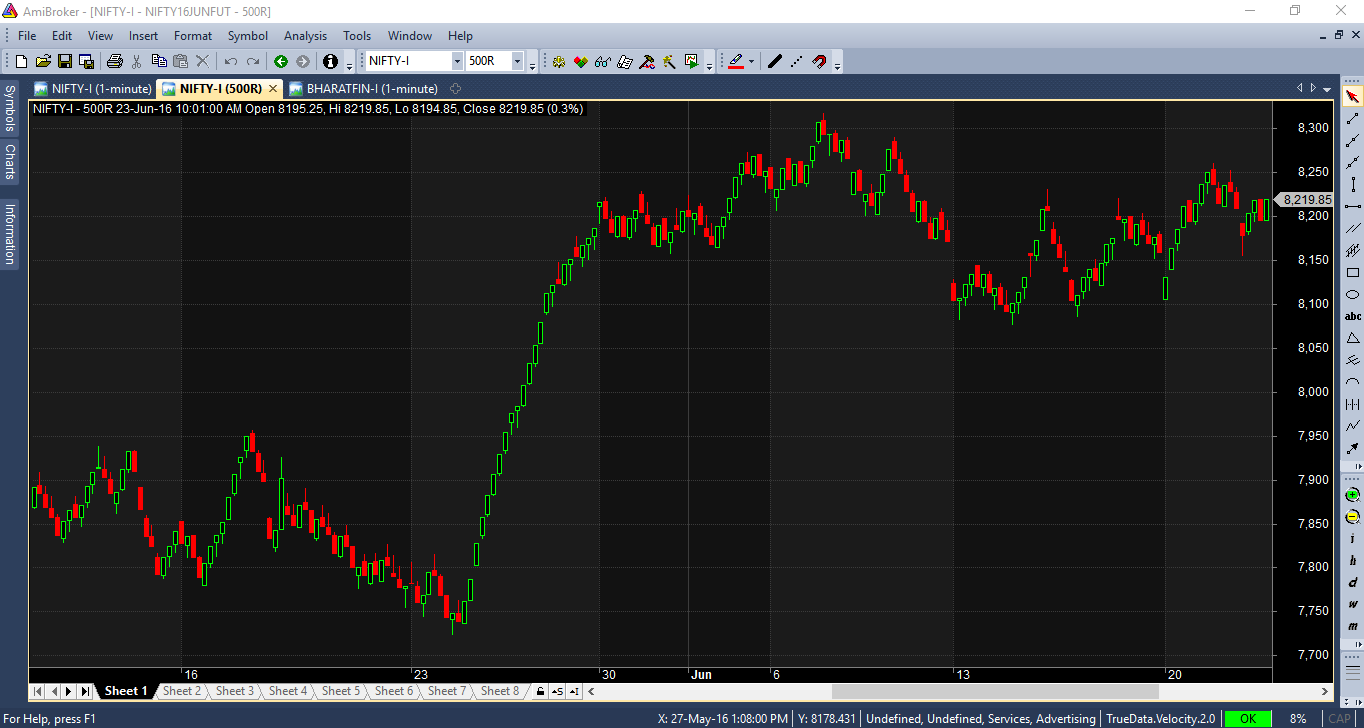
- Once done, you will need to then select the pre-defined interval from the View->Intraday menu. Another easy way is to use the Interval box in the toolbar and just type-in the desired bar size. For example, to select the range bar of 10 ticks, one can type in 10R in the toolbar. Range Bar Chart in Amibroker
Finally, it is worth noting ...
... that for best results, your database should use Tick as Base Time Interval. This will ensure that each trade is represented by an individual record in the database and can be consistently compressed to range bars. Using higher-interval data (such as 1 minute) may produce bars that are not perfect. This is especially so if, for a 1-minute bar, the high-low difference is comparable with the selected range.