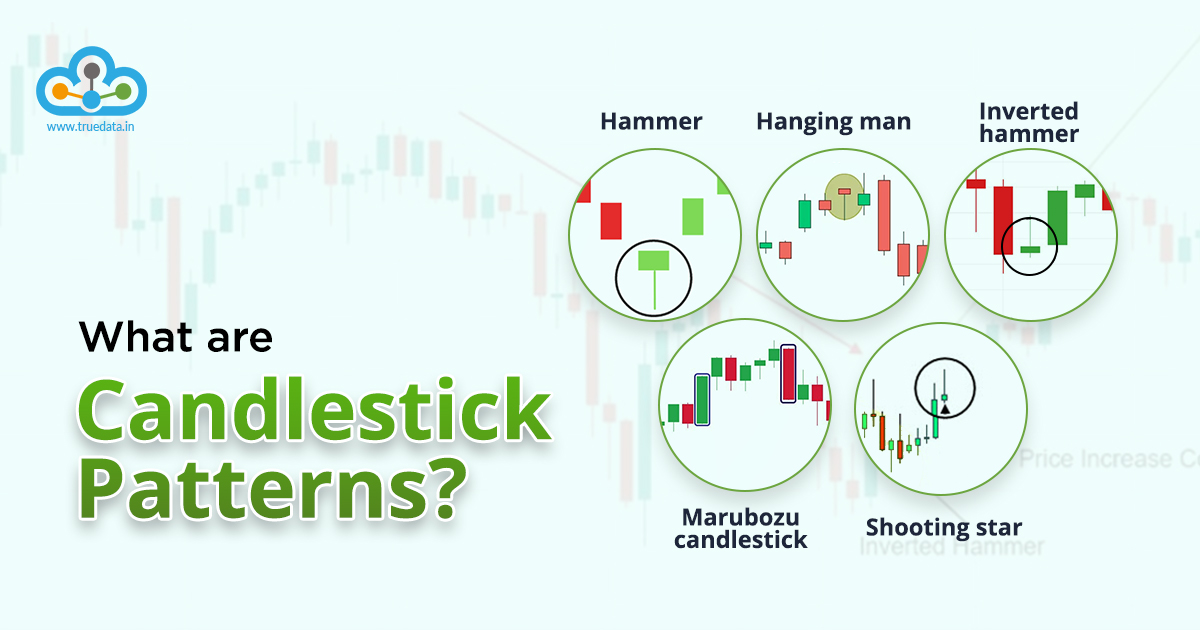
Stock investing and trading are becoming primary and secondary sources of income for many now. The increase in the push towards these career options was seen during the COVID lockdowns and now when there have been rampant job cuts across many sectors. The essentials of investing and trading are to know the basics of the market and the way to analyse every security. Fundamental and technical analysis tools to understand their price trends and to determine if they are a good investment bet. Candlestick patterns are among the various tools of technical analysis that traders often use on a daily basis. However, there are many types of candlestick patterns available for traders. Given below is the meaning of candlestick patterns and details of a few single candlestick patterns.

Candlestick patterns are a form of technical analysis therefore, before going ahead, we have to understand the meaning of technical analysis in brief. Technical analysis is the study of the price and volume movements of a stock or security like commodities, etc. This study functions on three core principles namely,
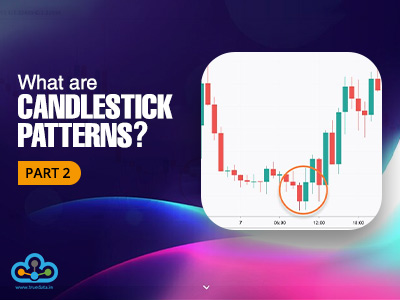
Candlestick patterns are a popular technical analysis tool that helps in understanding price and volume movements. It is essentially a chart that shows the opening price, the closing price as well as the highs and lows of the day. It has the name candlestick as it is similar to a wax candle that has a body, a wick, and also casts a shadow. Candlestick patterns can be used to interpret bullish patterns as well as bearish patterns.
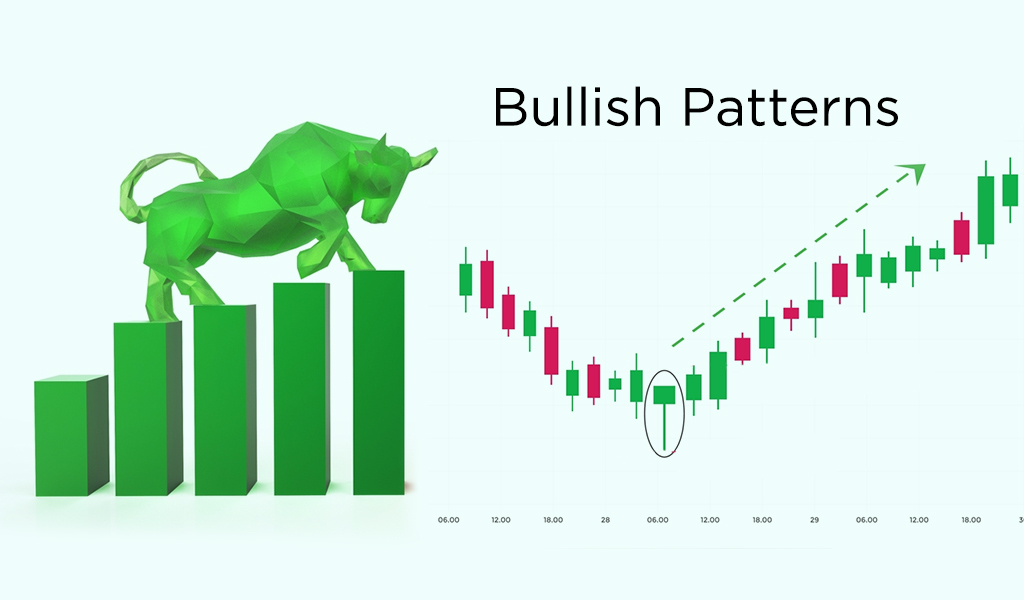
A bullish candlestick pattern has a green body with the bottom of the body representing the opening price and the top portion of the candle representing the closing price.
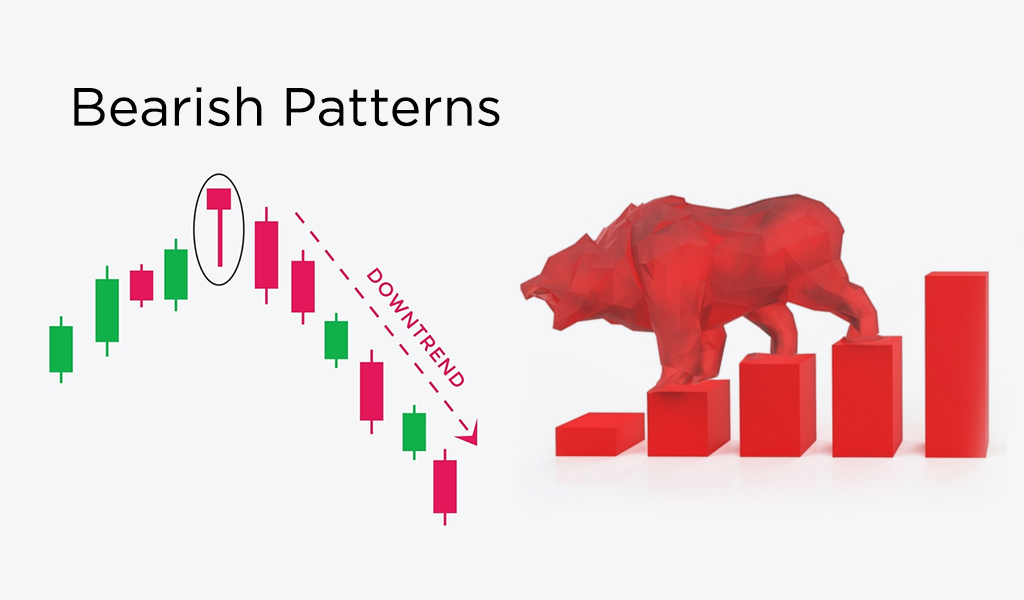
A bearish candlestick pattern is a red candle with the top portion of the candle representing the opening price and the bottom portion of the candle representing the closing price.
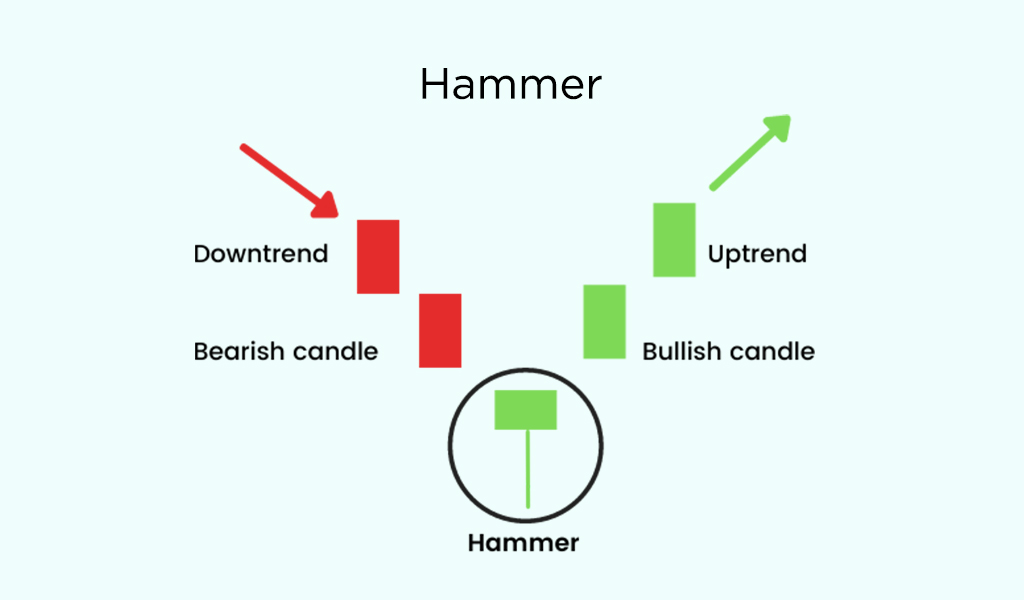
A hammer pattern also known as the bullish hammer pattern is a single candlestick pattern. This pattern is formed at the end of a downtrend signalling a reversal trend. This candlestick pattern has a small body and a wick which is at the bottom and is usually twice the size of the body. The premise for this candlestick pattern is the dominance of the bulls against the selling pressure which led to pushing the prices up and closing at a price that is higher than the opening price.
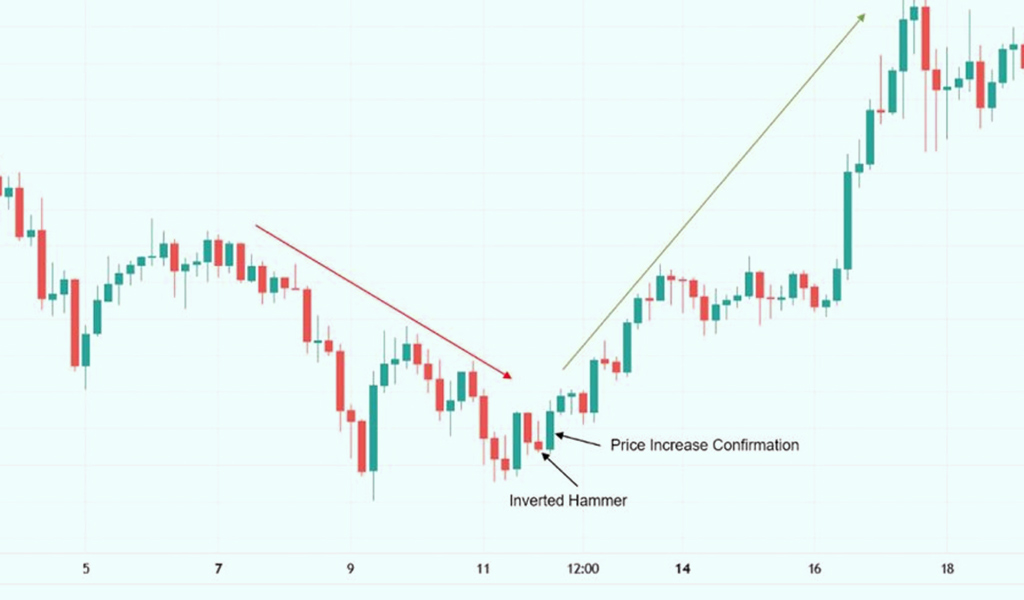
The Inverted Hammer pattern is similar to the hammer pattern as it also indicates the reversal of the downtrend. In this pattern, the hammer is inverted and the body is relatively small. The wick of the candle is at the top and is again twice the size of the body. It also has a long upper shadow in this candlestick pattern. The buyers again are dominant in this case resisting the sellers’ pressure and coming back with a higher push for the prices.
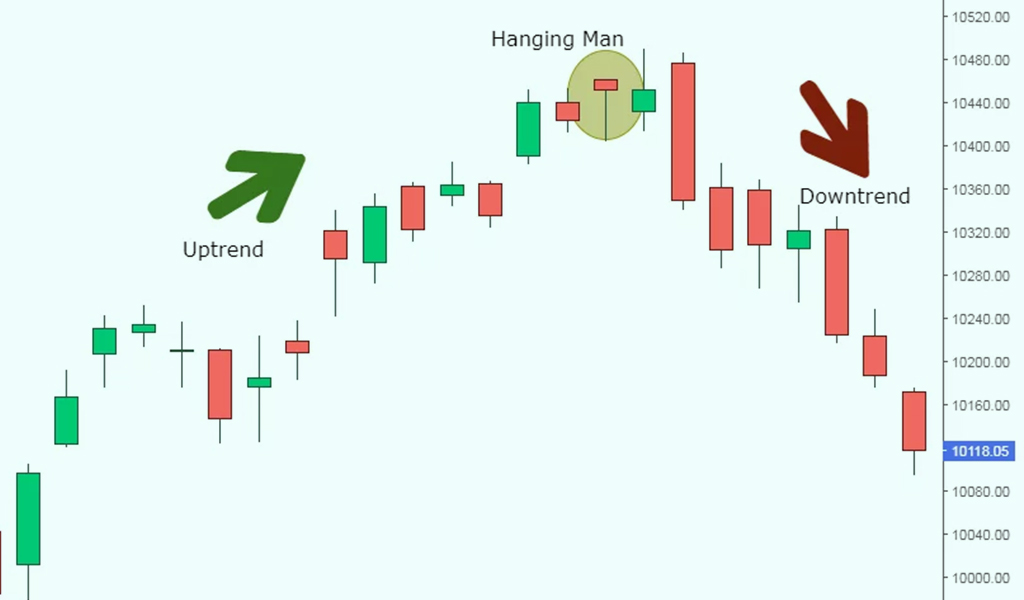
This is another single candlestick pattern that is seen at the end of an uptrend. This pattern looks similar to the hammer pattern where the body is small and the wick is long at the bottom, usually twice the size of the body casting a long lower shadow. This pattern indicates a reversal of the bullish trend where the sellers are in dominance and the bulls try to hold the prices up but eventually lose ground.
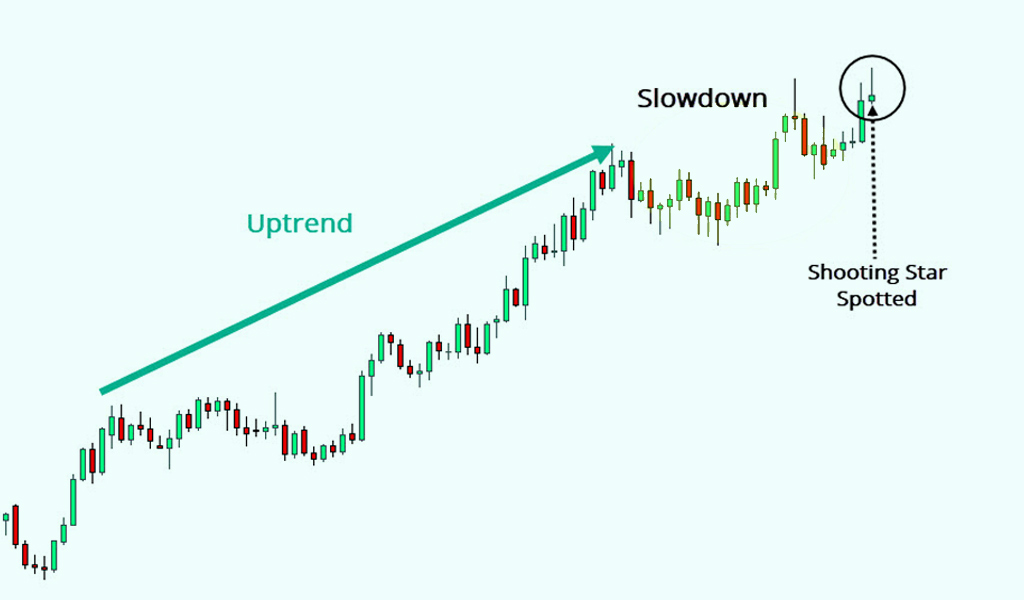
The shooting star pattern is similar to the inverted hammer pattern and indicates a reversal of the uptrend. This pattern is formed at the peak of the uptrend signalling a start of the downtrend where the bears are gaining control. The body in this pattern can be small or even negligible and it has a long wick casting a long shadow.
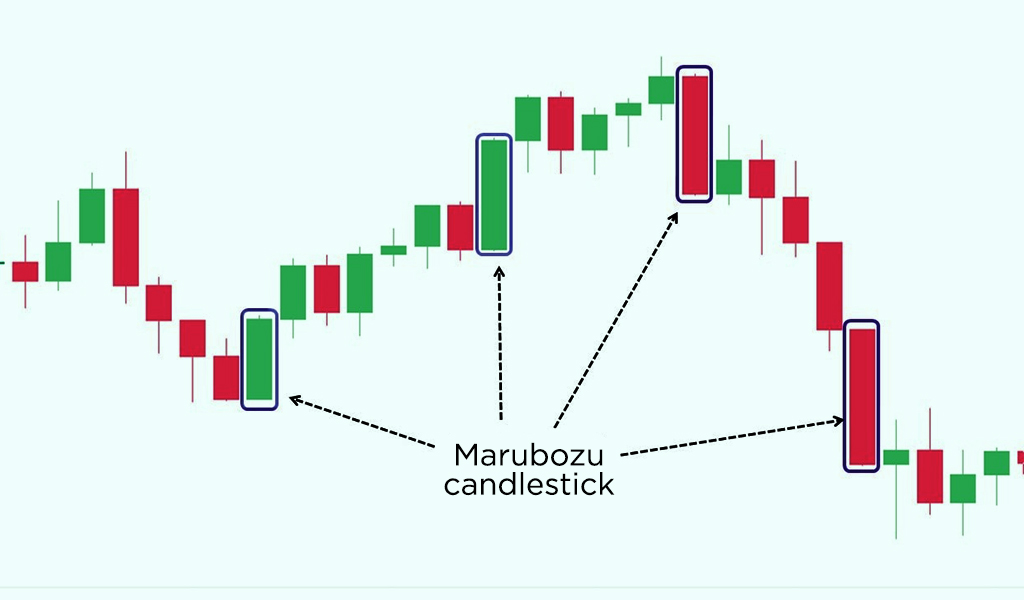
The Marubozu candlestick pattern is a Japanese Candlestick pattern that is used to identify bullish and bearish trends. The word ‘Marubozu’ literally means bald and in relation to this pattern, the candlestick has a solid body without any shadow. These patterns are fairly easy to identify and can indicate the reversal of a trend or continuation of the trend depending on the chart period.
These candlesticks form a white or green body indicating a bullish trend if the opening price of the day is equal to the low price of the day and the closing price of the day is equal to the high of the day. On the other hand, a red or black Marubozu candlestick pattern is formed indicating the bearish trend when the opening price of the day is equal to the high of the day and the closing price of the day is equal to the low of the day.
These were the top single candlestick patterns that are easily identifiable and can be used by traders to make successful trades. Besides the single candlestick patterns, there are several multiple candlestick patterns that involve the interpretation of a trend using two or three candlesticks. We will discuss more about them in the second part of the candlestick patterns that will come up shortly.
Traders use technical analysis tools like stock charts or candlestick patterns to understand the price movements of the securities. Therefore, using the candlestick patterns effectively ensures having a balanced portfolio, profitable even. It is also important to note that it is easy to misinterpret candlestick patterns, especially for novice traders. Therefore, for the correct interpretation of the candlestick patterns, it is important that the price trends should be backed by significant volume for establishing the trend.
Hope you have a clear idea of the single candlestick patterns and can use them with great ease to spot trend reversals or the establishment of a current trend. We will discuss all the patterns mentioned here in detail in future articles.
Till then Happy Reading!

Candlestick patterns are among the most basic and common tools traders use to cr...
Stock markets have been under a lot of pressure in the past week and investors ...

The world oftechnical analysis is filled with many tools like candlestick patter...